CFCE is particularly involved in developing technology for chromatin profiling in clinical tissues. As part of that effort, we have designed FiT-seq (Cejas et al. 2016) and FiTAc-seq (Font-Tello et al. 2020) techniques to perform histone profiling of clinical FFPE archived tissues.
We have successfully applied FiT-seq and FiTAc-seq to the analysis of a number of tumor types with storage times ranging from months to up to 10 years. The analysis of superenhancers by FiTAc-seq has revealed important biology to sub-classify Pancreatic Neuroendocrine Tumors (Cejas et al. 2019), understand the effect of CDK4/6 inhibitors in Breast Cancer (Watt. et al. 2020), discriminate melanomas with respect of their expression of MHC-II complex (Gu et al. 2020) and reveal the chromatin characteristics of different sub-types of Non-Muscle Invasive Bladder Cancer.
We have successfully applied FiT-seq and FiTAc-seq to the analysis of a number of tumor types with storage times ranging from months to up to 10 years. The analysis of superenhancers by FiTAc-seq has revealed important biology to sub-classify Pancreatic Neuroendocrine Tumors (Cejas et al. 2019), understand the effect of CDK4/6 inhibitors in Breast Cancer (Watt. et al. 2020), discriminate melanomas with respect of their expression of MHC-II complex (Gu et al. 2020) and reveal the chromatin characteristics of different sub-types of Non-Muscle Invasive Bladder Cancer.
FiTAc-seq - a method for histone H3K27ac profiling of FFPE tissues

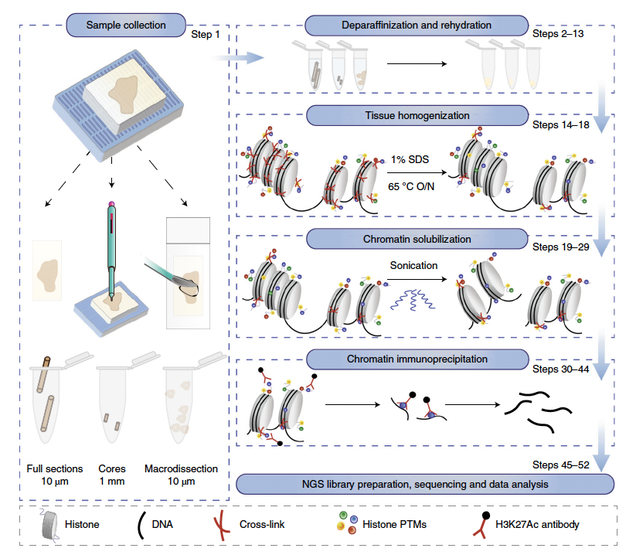
Schematic overview of the FiTAc-seq H3K27ac profiling protocol in FFPE samples. FFPE tissue can be collected from the block by whole or
macrodissected sectioning or from punched cores. The FFPE tissue goes through a process of deparaffinization, rehydration and antigen retrieval followed by the standard chromatin immunoprecipitation to profile H3K27ac.
macrodissected sectioning or from punched cores. The FFPE tissue goes through a process of deparaffinization, rehydration and antigen retrieval followed by the standard chromatin immunoprecipitation to profile H3K27ac.
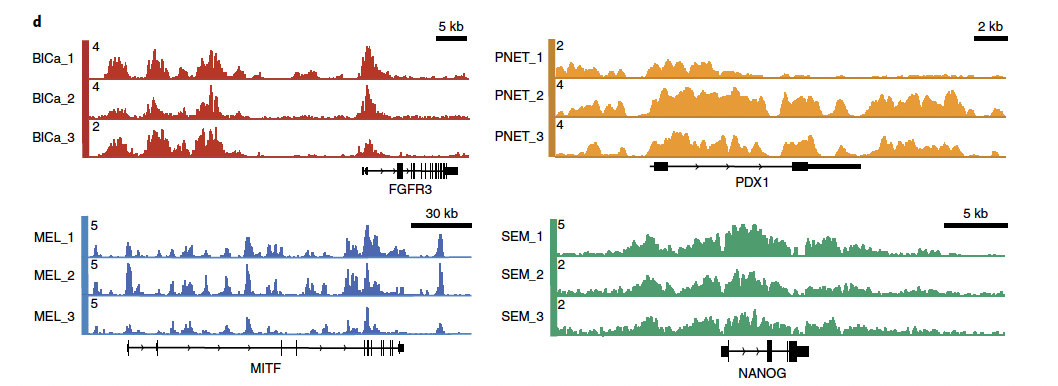
Superenhancers at lineage-specific loci for Bladder Cancer (BlCa) at FGFR3, Melanoma (MEL) at MITF, Pancreatic Neuroendocrine Tumors (PNET) at PDX1, and Seminoma (SEM) at NANOG).
References:
Font-Tello A, Kesten N, Xie Y, Taing L, Varešlija D, Young L, Hamid A, Van Allen E, Sweeney C, Gjini E, Lako A, Hodi F, Bellmunt J, Brown M, Cejas P, Long HW*. FiTAc-seq: Fixed-Tissue ChIP-seq for H3K27Ac profiling and super-enhancer analysis on FFPE tissues. Nat Prot. 2020 Aug;15(8):2503-2518
Font-Tello A, Kesten N, Xie Y, Taing L, Varešlija D, Young L, Hamid A, Van Allen E, Sweeney C, Gjini E, Lako A, Hodi F, Bellmunt J, Brown M, Cejas P, Long HW*. FiTAc-seq: Fixed-Tissue ChIP-seq for H3K27Ac profiling and super-enhancer analysis on FFPE tissues. Nat Prot. 2020 Aug;15(8):2503-2518
FiT-seq - a method for histone methylation profiling of FFPE tissues

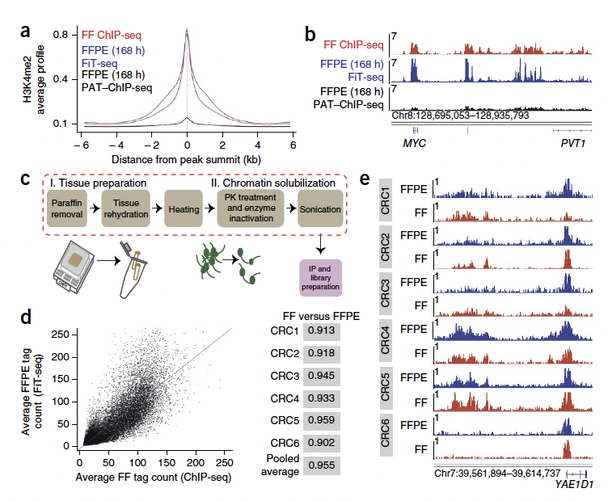
Development of FiT-seq, and its
effect on strength and resolution of histone mark signals. (a) Average distribution of H3K4me2 signals in mouse xenografts of
MCF-7 breast cancer cells either fresh-frozen (FF) and processed with conventional ChIP-seq or fixed in formaldehyde for 168 h and subsequently processed with the PAT–Chip protocol or using FiT-seq. The summits of the top 5,000 ChIP-seq peaks from the FF xenograft were used as the centers to build aggregate plots of the data from one replicate of each sample class. (b) Corresponding integrative genome viewer (IGV) tracks at a single representative, well-known locus (MYC), illustrating FiT-seq signals and comparing them to ChIP-seq signals obtained from FF MCF-7 xenograft samples. Each y axis indicates the number of reads per million per base pair (rbm). (c) Key steps in the FiT-seq protocol. (d) Correlation plot of average H3K4me2 signals in experiments on six pairs of FFPE and FF samples of primary CRCs. Each pair was taken from the same surgical specimen. All wiggle files from each sample type (FF or FFPE) were pooled for the analysis. Right column shows Spearman correlations for each individual pair and for the average signal from the pooled samples (for which the Pearson correlation was 0.876) represented in the correlation plot. (e) Representative IGV tracks at an arbitrary locus (Yae 1 domain containing 1; YAE1D1), illustrating concordance of H3K4me2 signals from FF samples analyzed by ChIP-seq (red) and matched FFPE samples analyzed by FiT-seq (blue) for six CRC specimens. The y axis represents number of reads per million per base pair (rbm).
Reference:
Cejas P, Li L, O'Neill NK, Duarte M, Rao P, Bowden M, Zhou CW, Mendiola M, Burgos E, Feliu J, Moreno-Rubio J, Guadalajara H, Moreno V, García-Olmo D, Bellmunt J, Mullane S, Hirsch M, Sweeney CJ, Richardson A, Liu XS, Brown M, Shivdasani RA, Long HW. Fixed tissue ChIP-Seq of archived clinical samples reveals chromatin dynamics and tissue-specific enhancer profiles. Nat Med. 2016, 22(6):685-91.
Cejas P, Li L, O'Neill NK, Duarte M, Rao P, Bowden M, Zhou CW, Mendiola M, Burgos E, Feliu J, Moreno-Rubio J, Guadalajara H, Moreno V, García-Olmo D, Bellmunt J, Mullane S, Hirsch M, Sweeney CJ, Richardson A, Liu XS, Brown M, Shivdasani RA, Long HW. Fixed tissue ChIP-Seq of archived clinical samples reveals chromatin dynamics and tissue-specific enhancer profiles. Nat Med. 2016, 22(6):685-91.
Additional References applying FiT-seq or FiTAc-seq:
Cejas P, Drier Y, Dreijerink K, Lodewijk B, Deshpande V, Epstein CB, Conemans EB, Morsink FHM, Valk GD, Fernandez-del Castillo C, Ferrone C, Adar T, Bowden M, Whitton H, Da Silva A, Gaskell E, Shoresh N, Sicinska E, Kulke MH, Chung DC, Bernstein BE, Shivdasani RA. Enhancer signatures stratify and predict outcomes of non-functional pancreatic neuroendocrine tumors. Nat Med. 2019, 25(8):1260-1265.
Watt AC, Cejas P, DeCristo MJ, Metzger-Filho O, Lam EYN, Qiu X, BrinJones H, Kesten N, Coulson R, Font-Tello A, Lim K, Vadhi R, Daniels VW, Montero J, Taing L, Meyer CA, Gilan O, Bell CC, Korthauer KD, Giambartolomei C, Pasaniuc B, Seo JH, Freedman ML, Ma C, Ellis MJ, Krop I, Winer E, Letai A, Brown M, Dawson MA, Long HW, Zhao JJ, Goel S. CDK4/6 inhibition reprograms the breast cancer enhancer landscape by stimulating AP-1 transcriptional activity. Nat Cancer. 2021 Jan;2(1):34-48.
Gu SS, Zhang W, Wang X, Jiang P, Traugh N, Li Z, Meyer C, Stewig B, Xie Y, Bu X, Manos MP, Font-Tello A, Gjini E, Lako A, Lim K, Conway J, Tewari AK, Zeng Z, Sahu AD, Tokheim C, Weirather JL, Fu J, Zhang Y, Kroger B, Liang JH, Cejas P, Freeman GJ, Rodig S, Long HW, Gewurz BE, Hodi FS, Brown M, Liu XS. Therapeutically Increasing MHC-I Expression Potentiates Immune Checkpoint Blockade. Cancer Discov. 2021 Jun;11(6):1524-1541.
HOME | RESEARCH | PEOPLE | COLLABORATIONS | PUBLICATIONS | INNOVATION | CONTACT US
©2023 Center for Functional Cancer Epigenetics at Dana-Farber Cancer Institute
©2023 Center for Functional Cancer Epigenetics at Dana-Farber Cancer Institute

